

| Current | v9 | v8 | v7 | v6 | v5 | v4 | v3 | v2 | v1 | All | About |
SimpleCompare
The following tables show how well SimpleCompare did against all four databases. The number of samples represents how many pcap files the input fingerprints were computed across. 1-sample means that the fingerprint was computed only from the first sample for a given implementation, while 3-sample means all three pcap files were used to generate the print.
Table 5.2 below shows how well SimpleCompare does when it is only analyzing durations, not (packet_type, duration) pairs. Table 5.3 shows how well SimpleCompare does when it only analyzed (packet_type, duration) pairs. Table 5.4 shows the results when both techniques are combined.
Table 5.2:
SimpleCompare, duration values only
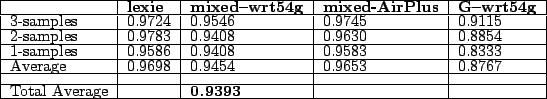
Table 5.3:
SimpleCompare, (packet_type, duration) pairs only

Table 5.4:
SimpleCompare combined.
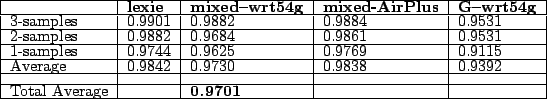
Though combining the two techniques did not improve the overall average, it did have one important effect. In the combined table, scores consistently increase with sample size, across all databases. This is not the case in either of the two tables preceding it. This is a very desirable property, and could arguably be worth the minor price paid in overall accuracy.