

| Current | v9 | v8 | v7 | v6 | v5 | v4 | v3 | v2 | v1 | All | About |
Results
This section presents performance results for each of the
duration-based matching metrics described in chapter
4. To compare the performance of these metrics, a
rating system was devised as follows. Each metric was exercised
across four print databases using three packet capture samples
 ,
,  , and
, and  as input for each 802.11 implementation. We
define for each 802.11 implementation I, a success
probability
as input for each 802.11 implementation. We
define for each 802.11 implementation I, a success
probability  for a matching metric M. It is the
probability that M correctly identifies a sample, that is,
identifies that sample as originating with I when it does
indeed originate with I.
for a matching metric M. It is the
probability that M correctly identifies a sample, that is,
identifies that sample as originating with I when it does
indeed originate with I.
For example, consider Table 5.1. This print database has 13 fingerprints hence there are 13 entries. The table was produced by using the MediumCompare metric on a particular sample. The tables tells us that this metric believes the sample originated with the Broadcom-MiniPCI (ID 10 in the table) since it has rank zero. But this is incorrect. The sample originated with the Apple-Airport Extreme (ID 5), which has rank "1". So we take as SimpleCompare's probability of succeeding when the sample originates with Apple-Airport Extreme to be (13 - rank)/13 or (13 - 1)/13 since the correct implementation is given rank "1" by the metric.
Now since there are three samples, we extend RI for a metric
M to be ![$RI = [(13 - s_1 rank) + (13 - s_2 rank) + (13 - s_3
rank)] / (3 * 13)$% WIDTH=442 HEIGHT=32](5/1/img40.png) (eq 5.1) where
(eq 5.1) where  rank is the rank assigned by
M to the 802.11 implementation I that actually produced
sample . If the probability that I occurs is
rank is the rank assigned by
M to the 802.11 implementation I that actually produced
sample . If the probability that I occurs is  then
the success rate of M is the unconditional probability of
success given by
then
the success rate of M is the unconditional probability of
success given by 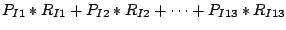
Each term in this sum is the product of the probability of seeing a
sample from one of the 13 implementations and the probability of
M succeeding to identify it in that case. So M could
have a good overall success rate even though it performs badly when
trying to identify a sample as belonging to some 802.11
implementation if that implementation doesn't arise often. However,
we shall assume that implementations are equally likely to occur. In
that case, the sum above becomes  .
.
Table 5.1:
Ordered list generated from a matching metric
Subsections