

| Current | v9 | v8 | v7 | v6 | v5 | v4 | v3 | v2 | v1 | All | About |
Duration-Print-Grader
duration-print-grader performs the same analysis as duration-print-matcher, however it does it on a much larger scale. Every implementation included in a database had 3 different captures taken of it associating to a network. duration-print-grader takes all these pcaps, attempts to match them to the database of prints on disk, and keeps track of the amount of error in terms of distance down the sorted list the correct print for that pcap is found. A table representing the output of duration-print-grader is below C.2.
Table C.2:
output from: ./duration-print-grader -P ./print-db/lexie/
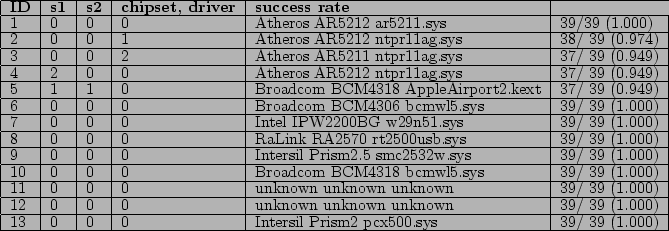
-num errors across DB: 7 success rate across DB: 12.820513 / 13 = 0.9862
Samples s1,s2,s3 refer to the three sample pcaps for a given implementation. The first sample in the row for ID 5 corresponds to the previous example from duration-print-matcher. This has value of 1 because the correct print was 1 deep in the list for sample 1.
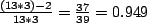
The column on the right is the success rate of the specified algorithm for a single implementation. It is computed using equation 5.1 which can be expressed as where misplacement distance is the sum of the ranks for the three samples For instance, for the airport extreme (implementation ID #5) we get the following accuracy:
Chapter 6 covers the details, but by taking the weighted average of these individual success rates where the rate is the likelihood of seeing an implementation, we can compute a success rate across the entire database. When using duration-print-grader the likelihood of seeing an implementation is constant, and the individual success rates are all weighted equally. In the example above, the success rate across the database turns out to be 12.805555 / 13 = 0.9850.